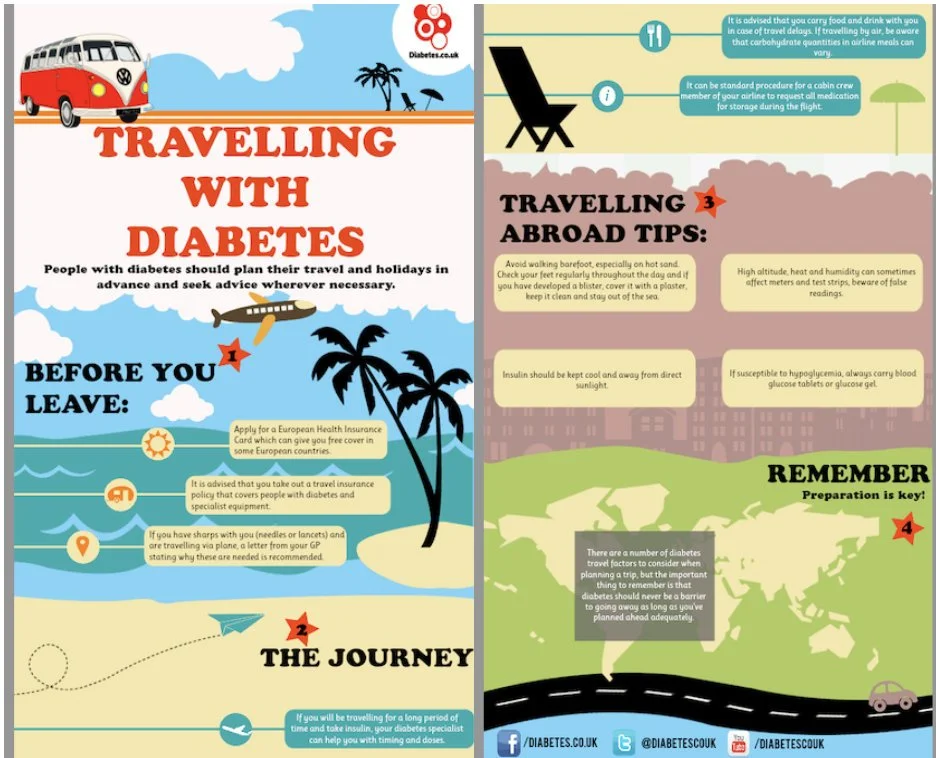
Access the full infographic here.
Beyond Description: What Paper 1 Really Rewards
Infographics can seem easier than written texts because they use images, colours, and short phrases. However, to score highly in IBDP English Paper 1, you must do more than describe what you see. A strong response explains how visual and language features shape meaning, target the audience, and achieve the text’s purpose.
Start with Purpose and Audience
First, identify the infographic’s purpose and audience. For example, in the essay on “Travelling with Diabetes,” the student clearly states that the infographic aims to inform and advise diabetic travellers and their families. This is effective because every later point connects back to this purpose.
Analyse Visual Features, Not Just Colours
Next, analyse visual features carefully. Instead of simply saying the infographic is colourful, explain the effect. In the example essay, the student analyses the large red title, explaining that red creates urgency because the topic is health and safety. The essay also comments on the camper van, palm trees, aeroplane, beach, map, and road, showing how these images create a reassuring travel theme.
Follow the Structure and Layout
Structure is also important. High-scoring responses notice how information is organised. The example essay explains that sections such as “Before You Leave,” “The Journey,” and “Travelling Abroad Tips” guide the reader through the stages of travel. This shows understanding of how layout helps make medical advice manageable.
Explain the Effect on the Reader
To improve your analysis, always explain the effect on the reader. For instance, icons and numbered stars are not just decorative; they help readers scan information quickly and understand that preparation happens in stages.
Do Not Forget Language Analysis
Language analysis matters too. The essay discusses imperatives like “Apply,” “take out,” and “carry,” showing how they create an authoritative tone and encourage responsibility.
Evaluate, Don’t Just Praise
Finally, evaluate effectiveness. A strong Paper 1 does not only praise the text. The example conclusion notes that the colourful design attracts attention but may also make the serious medical advice seem less urgent. This balanced judgement shows sophistication.
Final Tip: Link Everything Back to Purpose
To score highly, remember: identify, analyse, explain effect, link to purpose, and evaluate.
Exemplar Essay
This infographic, titled “Travelling with Diabetes,” was produced by Diabetes.co.uk, an online platform that provides information and support for people living with diabetes.
This infographic, titled “Travelling with Diabetes,” aims to inform and advise people with diabetes on how to travel safely through careful preparation. It is likely aimed at diabetic travellers and their families, who may need practical medical guidance before going on holiday. Rather than presenting this information in a clinical or intimidating way, the infographic uses bright colours, travel-related imagery, bold headings, icons, and short instructions to make the advice accessible and reassuring. Overall, the infographic suggests that travelling with diabetes is possible and enjoyable, but only if the reader plans ahead responsibly.
To begin with, the infographic’s visual hierarchy immediately establishes the topic and attracts the reader’s attention. The bold title, “TRAVELLING WITH DIABETES,” is written in large red lettering, making it one of the most noticeable elements on the page. The colour red creates a sense of urgency, which is appropriate because the infographic deals with health and safety. At the same time, the surrounding travel imagery, such as the camper van, palm trees, aeroplane, beach, map, and road, creates a holiday atmosphere. This combination is effective because it balances seriousness with reassurance: the reader is reminded that diabetes requires careful management, but the cheerful travel imagery also suggests that the condition does not have to prevent people from enjoying holidays.
The infographic’s structure also supports its advisory purpose by guiding the reader through the travel process in a clear sequence. It is divided into sections such as “Before You Leave,” “The Journey,” “Travelling Abroad Tips,” and “Remember,” which reflects the different stages of a trip. This organisation helps simplify potentially overwhelming medical advice, as readers can focus on one stage of preparation at a time. The vertical layout also resembles a journey, moving from the planning stage at the top to the road at the bottom. This reinforces the idea that safe travel is not achieved through one single action, but through continuous preparation before, during, and after the journey.
Alongside this clear structure, the infographic uses icons and numbered stars to make the information easier to scan. Symbols such as the sun, medicine, location pin, aeroplane, food, and information icon visually represent different types of advice, allowing readers to identify key points quickly. This is especially effective for the target audience because travellers may need to find important safety information quickly while preparing for or taking a trip. The numbered red stars also create a sense of progression, suggesting that preparation happens in stages. In addition, the bright blue skies, beach colours, and green landscapes create a positive and reassuring tone. These colours prevent the topic of diabetes from seeming frightening, while the warning-style medical advice still reminds readers that planning is necessary.
In addition to its visual features, the infographic’s language is direct and practical, which strengthens its informative purpose. The use of imperative phrases such as “Apply for a European Health Insurance Card,” “take out a travel insurance policy,” and “carry blood glucose tablets” creates an authoritative tone. These commands position the reader as someone who must take responsibility for their own safety. This is effective because the infographic does not simply explain the risks of travelling with diabetes; it gives clear solutions and actions the reader can follow. The short pieces of advice are also suitable for an infographic because they make complex medical guidance more concise and manageable.
Finally, the closing section, “REMEMBER: Preparation is key!”, summarises the central message of the whole text. The word “REMEMBER” is written in bold capital letters, making it feel like a final reminder or warning. This leaves the reader with a clear takeaway: diabetic travellers can enjoy holidays safely if they plan ahead carefully. By ending with this statement, the infographic reinforces its main purpose and ensures that the audience remembers the importance of preparation even after they have finished reading.
In conclusion, the infographic successfully conveys its purpose by combining practical medical advice with an engaging travel theme. Its organised sections, bold typography, and instructional language all work together to reassure people with diabetes that travel is possible, while also reminding them that safety depends on careful planning and responsible preparation. However, while this visually engaging approach helps capture the reader’s attention, it also reflects how media can sometimes prioritise colourful images and busy design in a way that may make serious medical advice seem less urgent.